Prometheus Features
Prometheus
|
|

|
What does Prometheus offer?
|

Inclusive Monitoring
|
|
|
Powerful Data Model
|
Manageable and Reliable
|
|
|
Efficient
|
Scalable
|
|
|
Easy to Integrate with
|
Altnix Advantage
Prometheus Consulting
Altnix provides professional services for Consulting on Prometheus monitoring too including the following:
- Consulting on adoption of Prometheus monitoring tool
- In-Depth Analysis of your monitoring requirements and scope study
- Architecture Definition and hardware sizing guidelines
- Solution Design Document with Prometheus that can be handed over to engineers for implementation
- Future Roadmap for evolution of Prometheus
Prometheus Implementation and Deployment
Altnix will implement Prometheus based monitoring solutions keeping in mind the business requirements. Implementation includes the following:
- Prometheus tool installation and resolution of dependencies
- Development and Implementation of Monitoring Items
- Configuration of Exporters, Scripts and Monitoring KPIs
- Alert Management in Prometheus
- UAT sign off after consultation with customer
- Production Implementation and Go Live
- Documentation and Handover
Prometheus Customization
Altnix will customize your Prometheus installation so that it is a better fit to your business environment.
- Adding new exporters and plugins for Prometheus
- Developing new Exporters and Plugins with Prometheus
- Developing new scripts for Monitoring KPIs
- Custom MIB for SNMP based Monitoring
- Customization for Database Monitoring
- Customization for Applications Monitoring
- Customization for IaaS, PaaS, Virtual Infrastructure and Container Monitoring
Third Party Integration
Altnix will integrate Prometheus with other third party tools to meet several business use cases.
- Ticketing systems such as IBM NetCool, BMC Remedy, Zendesk, and ((OTRS)) Community Edition
- IT Automation tools such as StackStorm, Ansible, Chef and Puppet
- Analysis tools such as ElasticSearch ELK Stack, JasperSoft and Metabase Business intelligence software
- Visualization tools such as Grafana, Graphite and Cacti
24x7 AMC Support Services
Altnix offer 24x7 support services on an AMC or per hour basis for new or existing installations on Prometheus. Our team of experts are available round the clock and respond to you within a predefined SLA.
Case Studies
 |
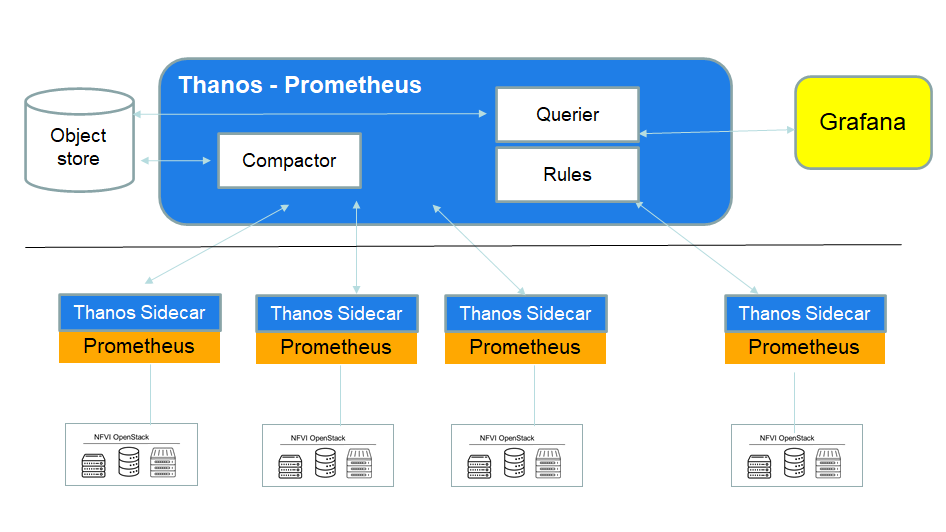
Case Study: 4G/5G Cloud Infrastructure: TelecomNew 4G/5G Services for Telecom are being rolled out using a flexible Cloud infrastructure that uses the concept of Network Function Virtualization (NFVI). For leveraging maximum benefit from NFVI, it is important to know exact usage of the infrastructure as well as any performance bottlenecks. |
Customer Highlights
|
Solution Highlights
|
|
|
|
||
|
Industry: Telecom Products: Prometheus, Thanos, Grafana, ElasticSearch |
White Papers
Coming Soon.