Grafana Features
|
Observability
|

Visualization and Insights
|
|

|
Correlation
|
Enterprise Features
|
|
Altnix Advantage
Official Partner for Grafana
Altnix is now an official partner for Grafana Enterprise software. Grafana is the number one open source software for Observability, Visualization, Dashboards and Correlation for data coming from different sources.
Grafana Business Analysis and Architecture Design
Altnix provides business analysis and architecture design for Grafana and related products around end to end IT infrastructure monitoring. Grafana architecture design includes the following:
-
In-Depth Analysis of your monitoring requirements and scope study
-
Hardware Sizing Guidelines and choice of physical versus virtual hardware
-
Integration with other Enterprise tools and business processes such as Ticketing System, ERP tools, Databases, Process Management tools
-
Solution Design Document that can be handed over to engineers for implementation
Grafana Implementation and Deployment
Altnix will implement Grafana based monitoring solutions keeping in mind the business requirements. Implementation includes the following:
-
Hardware Readiness and Preparation
-
Test and development Phase
-
UAT sign off after consultation with the customer
-
Production Implementation and Go Live
-
Warranty Support Period Included
Grafana Dashboard Customization
Altnix will customize your Grafana installation so that it is a better fit for your business environment.
-
Adding new Dashboards in Grafana
-
Creating new visualizations and dashboards as per customer needs
-
Creating Charts as per customer needs
-
Adding new monitoring scripts, plug-ins and components if needed
-
Creating new reports from Dashboards and Widgets
Third-Party Integration
Altnix will integrate Grafana with other third-party tools to meet several business use cases.
-
Monitoring tools such as Prometheus, Zabbix, Nagios and OpenNMS
-
Network Management and Orchestrator tools such as HP NNM and Spiceworks
-
ITSM Tools such as Service Now, HPSM, OTRS, GLPI, and other open-source ticketing tools
- Databases such as Oracle, MS SQL, MySQL, MongoDB, and PostgreSQL
24x7 AMC Support Services
Altnix offers 24x7 support services on an AMC or per hour basis for new or existing installations on Grafana. Our team of experts are available round the clock and respond to you within a pre-defined SLA.
Case Studies
 |
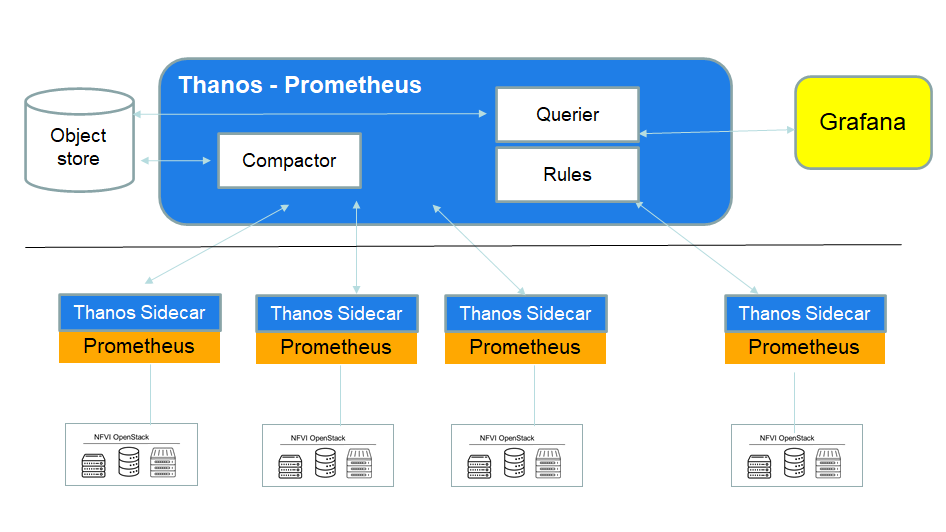
Case Study: 4G/5G Cloud Infrastructure: TelecomNew 4G/5G Services for Telecom are being rolled out using a flexible Cloud infrastructure that uses the concept of Network Function Virtualization (NFVI). For leveraging maximum benefit from NFVI, it is important to know exact usage of the infrastructure as well as any performance bottlenecks. |
Customer Highlights
|
Solution Highlights
|
|
|
|
||
|
Industry: Telecom Products: Prometheus, Thanos, Grafana, ElasticSearch |
White Papers
Coming Soon.